
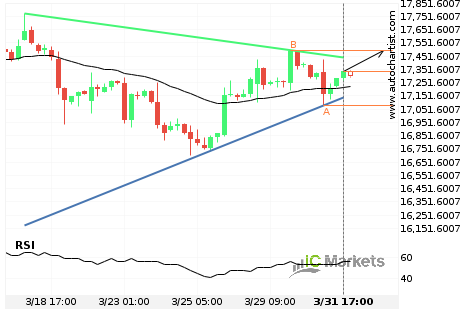
Breach of resistance line imminent by FTSE China A50 Index
FTSE China A50 Index is moving towards the resistance line of a Triangle which it has tested numerous times in the past. We have seen it retrace from this line before, so at this stage it isn’t clear whether it will breach this line or rebound as it did before. If FTSE China A50 Index […]

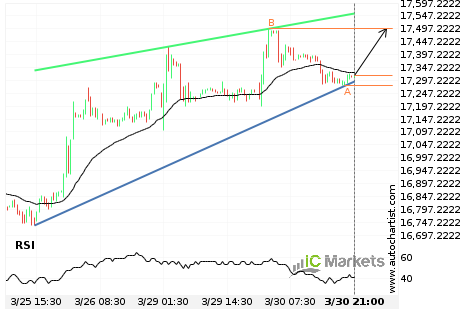
Will FTSE China A50 Index have enough momentum to break resistance?
FTSE China A50 Index is heading towards the resistance line of a Rising Wedge and could reach this point within the next 21 hours. It has tested this line numerous times in the past, and this time could be no different from the past, ending in a rebound instead of a breakout. If the breakout […]
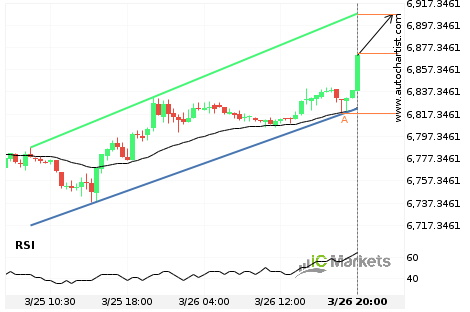
Should we expect a breakout or a rebound on Hong Kong 50 Index?
The movement of Hong Kong 50 Index towards the support line of a Rising Wedge is yet another test of the line it reached numerous times in the past. We expect this line test to happen in the next 6 hours, but it is uncertain whether it will result in a breakout through this line, […]

Will Australia 200 Index have enough momentum to break resistance?
Australia 200 Index is heading towards the resistance line of a Channel Up and could reach this point within the next 10 hours. It has tested this line numerous times in the past, and this time could be no different from the past, ending in a rebound instead of a breakout. If the breakout doesn’t […]
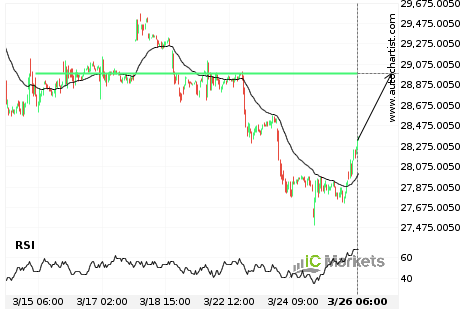
Hong Kong 50 Index – getting close to psychological price line
Hong Kong 50 Index is moving towards the resistance line of a Resistance. Because we have seen it retrace from this positions in the past, we could see either a break through this line, or a rebound back to current lines. It has touched this line numerous times in the last 12 days and may […]
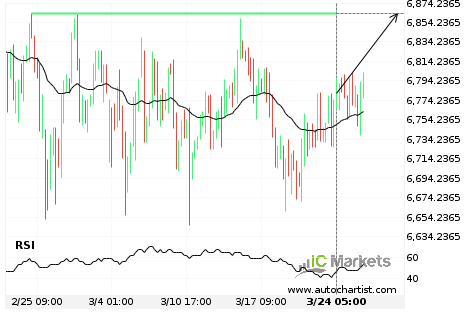
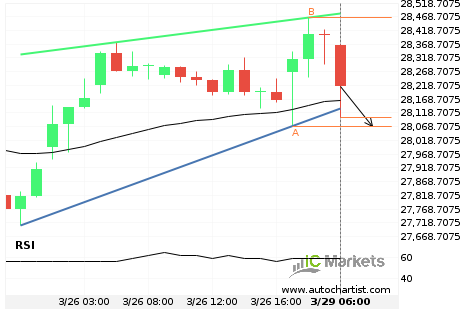
Should we expect a breakout or a rebound on Australia 200 Index?
The movement of Australia 200 Index towards 6863.3599 price line is yet another test of the line it reached numerous times in the past. We expect this line test to happen in the next 3 days, but it is uncertain whether it will result in a breakout through this line, or simply rebound back to […]